Update: We've published all of these graphs again a month later.
We find ourselves in a really interesting time with things changing rapidly on an almost day to day basis. I've always found human psychology interesting and being a fan of Google Trends, I wanted to pull together some graphs to show real changes amongst all of us. I've looked at South Africa as that's where we operate from but included a Worldwide look too for comparative purposes and interesting insights.
Before we jump into some interesting trends, let's have a quick look at the growth of queries around coronavirus:
Note: Numbers represent search interest relative to the highest point on the chart for the given region and time. A value of 100 is the peak popularity for the term. A value of 50 means that the term is half as popular. A score of 0 means there was not enough data for this term.
South Africa: Coronavirus
Worldwide: Coronavirus
Right, let's get on with this!
As a digital marketing agency, it's only fitting that we first look at the likes of eCommerce and what's going on in terms of human demand for the purchasing of items online:
South Africa: "buy online"
Worldwide: "buy online"
It's not surprising to see this spike in online queries about buying online but the real question is, how many people who previously didn't shop online have now been forced to and will that change how they do things in the future even in a post-Covid world?
We all know that the tourism industry in South Africa (and around the world) is taking great strain at the moment. Nobody is flying, holidaying, taking business trips or anything. But how drastic is the decline? These graphs paint a scary picture:
South Africa: Travel
Worldwide: Travel
I'm quite certain that in a post-Covid world, most of this will return to normal. I find it very difficult to imagine people not wanting to travel as much. Naturally, it will take time to return to the usual levels but it will return in my opinion.
I wanted to dig into some interesting topics and probably ran about 100 queries through Google Trends to pull out these graphs.
South Africa: Hand sanitiser and masks
Worldwide: Hand sanitiser and masks
Looking at the South African chart specifically, this makes sense to me. In the beginning, there was absolute chaos about hand sanitiser and I suspect that the graph drops down due to a combination of people not panicking as much and having already acquired hand sanitiser. In terms of masks, this one I find myself wondering a bit more - there's been a lot of mixed news about whether masks help or not, this is naturally going to impact on the demand around this query. I'm interested to see if the demand around masks becomes somewhat stable in a post-Covid world. In a country like China, you often see people in masks, I wonder if wearing masks won't become more common in other countries after all of this. Perhaps time to buy shares in NYSE:3M, quite a strong decline in their share price but some good recovery appears at hand, add the almost 4% dividend yield, hmmm.
A lot of people are facing unemployment, businesses closing down and similar, it breaks my heard to see graphs like this:
South Africa: unemployment
Worldwide: unemployment
I truly hope that this situation will pass as soon as it possibly can so that people are able to get back to their lives and resume their careers. Our economy is going to (has already) take a serious knock from all of this, off the back of a bad position as is. I wrote about Corona Stock Markets just the other day if you're interested in that. I'm not an economist so I'm going to leave that there, all I want to see is the unemployment rate getting better!
We've probably all read about Netflix and the massive uptake in usage. Netflix reduced the bitrate in South Africa. This wasn't purely about South Africa, I also read an article about reducing bitrate in Europe. For this reason, I wanted to look at Netflix, Amazon Prime, Hulu and the likes to see what's going on in that regard:
South Africa: Entertainment
Worldwide: Entertainment
With both the sale of alcohol and cigarettes being banned in South Africa I had expected a massive increase in online queries around this term. Fascinating how people react when they're told they cannot do something. Here's the graph, only for South Africa, though:
South Africa: Cigarettes
South Africa: Alcohol
I looked at all sorts of hobbies that people do at home; probably tested about 50 hobbies (for example chess, knitting, reading, instrument, journaling, cooking, photography, sleep, guitar, yoga, sport, board games, self-improvement, braai, writing, self-improvement, gardening, upcycle, baking, etc._ and these are the ones where I see a fairly large impact in growth of queries.
South Africa: Knitting
South Africa: Journaling
South Africa: Cooking
South Africa: Yoga
South Africa: Board Games
South Africa: Sport
South Africa: Gardening
South Africa: Baking
On a personal note, I love gardening and I've noticed a considerable increase in the information available about indoor gardening. I do follow local indoor junglists but the majority of my information does come from overseas, often because of apartment living. I wanted to quickly grab a WorldWide graph to see how that's going:
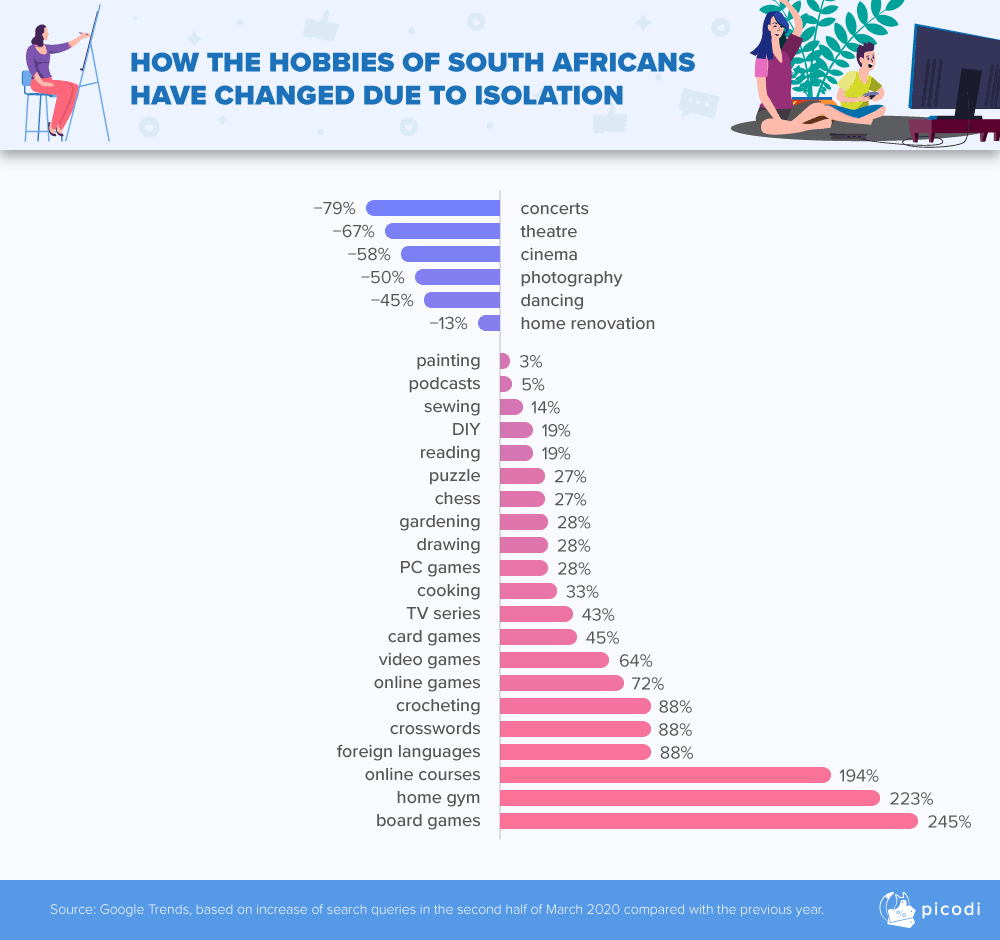
After writing this article, I also came across the following infographic:
Of course, what's a blog post like this without looking at some financials?
South Africa: "rand dollar"
South Africa: credit card
South Africa: debt
And, let's have a quick look at connectivity:
South Africa: mobile data
South Africa: Wifi
South Africa: Banks
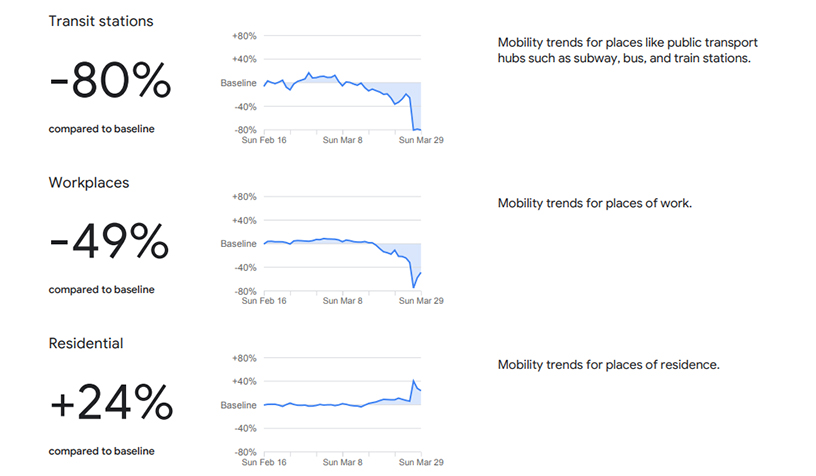
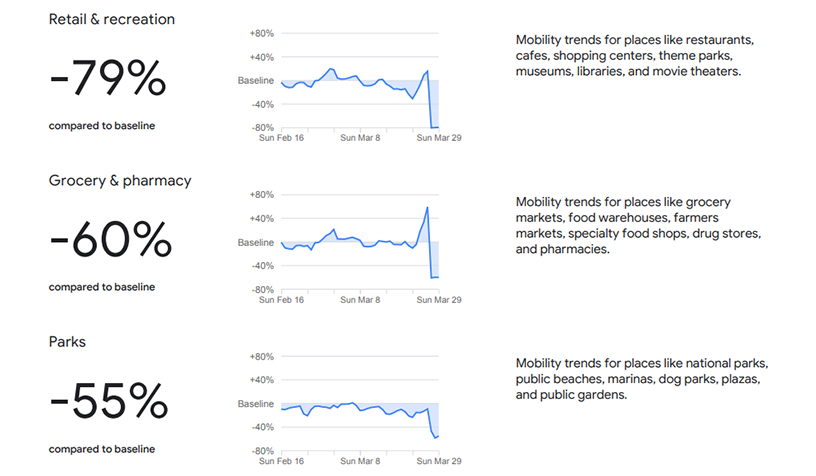
Google Local also published the following statistics a couple of days ago and in light of this post being about trends, I felt they would be fitting. The graphs show a decrease in the human movement at a specific location. This data is based on South Africa.
I hope you've found these graphs interesting. What will be even more interesting is to look back at all of them in a year to see what's happened.
Note: I chose to share the graphs with static information rather than dynamic in order to make the post make sense.