We're forever being asked what the Click Through Rate (CTR) is for the different positions that a website may appear in the Google Search results. In other words, if you're ranked in position 1 on page 1 of Google, what percentage of the clicks do you get? Similarly, if you're in position 2 or 3 or 4, what percentage do you get?
The Internet Marketing Ninja's have conducted surveys before and they've conducted another one recently. This latest survey takes some new factors into account and allows for the data to be more accurate. They used 20,000 search queries over the period of 3 months and clocked up 64 million impressions and 4 million clicks. On top of this, they evenly distributed things between B2C and B2B, as well as distinguished between brand and non-brand terms. A great foundation for some accurate results in our opinion.
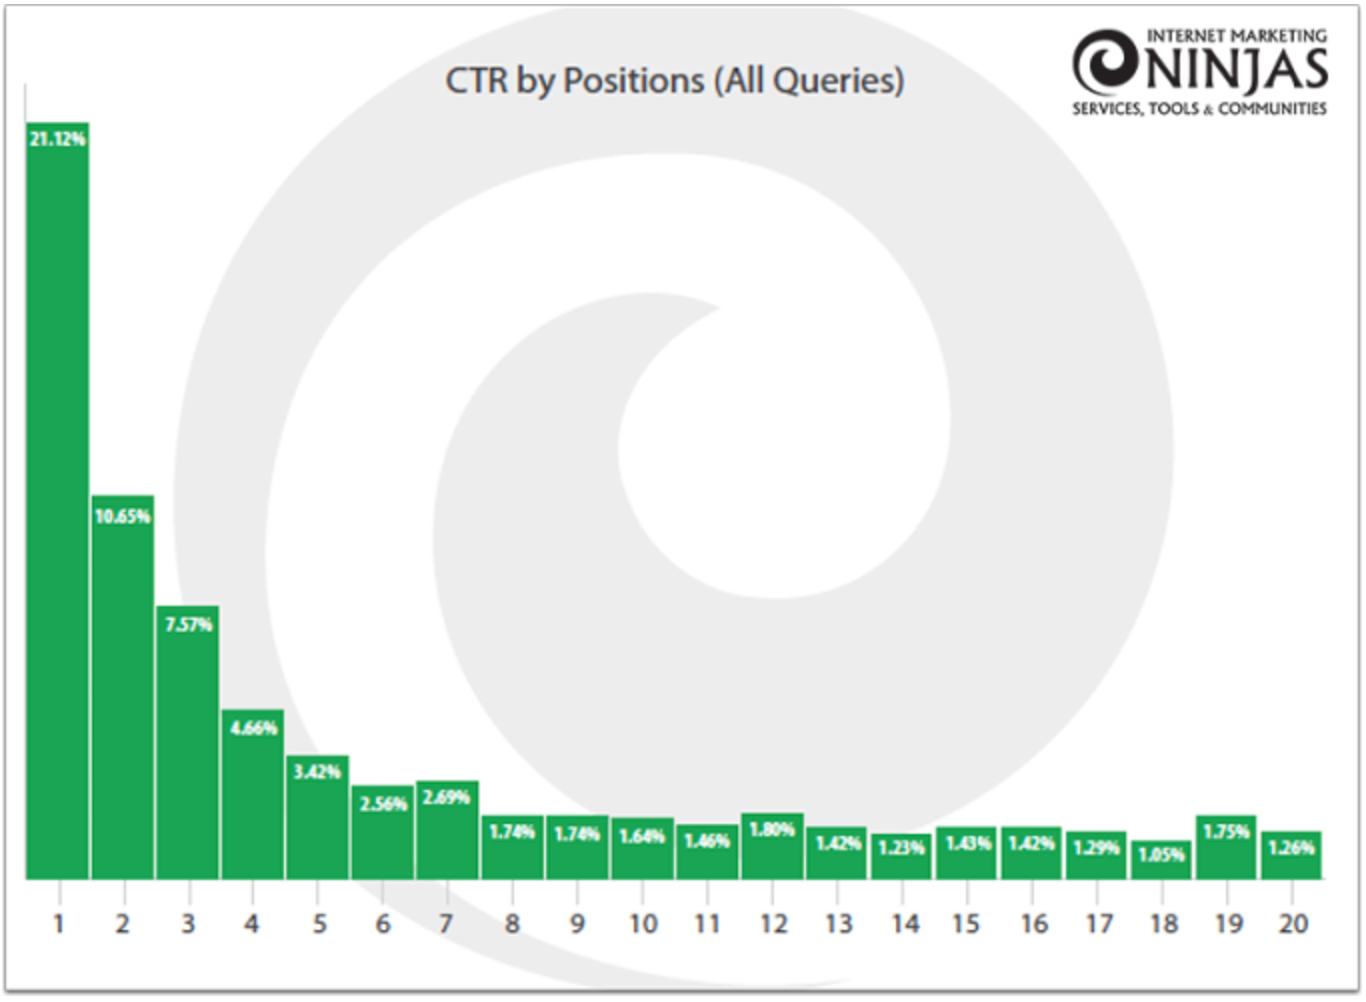
The first graph that they've produced is one that takes all the queries into account, this can be seen as our overall results and quickly addresses the question asked at the beginning of this post. What is the CTR for your position in Google? Here you go:
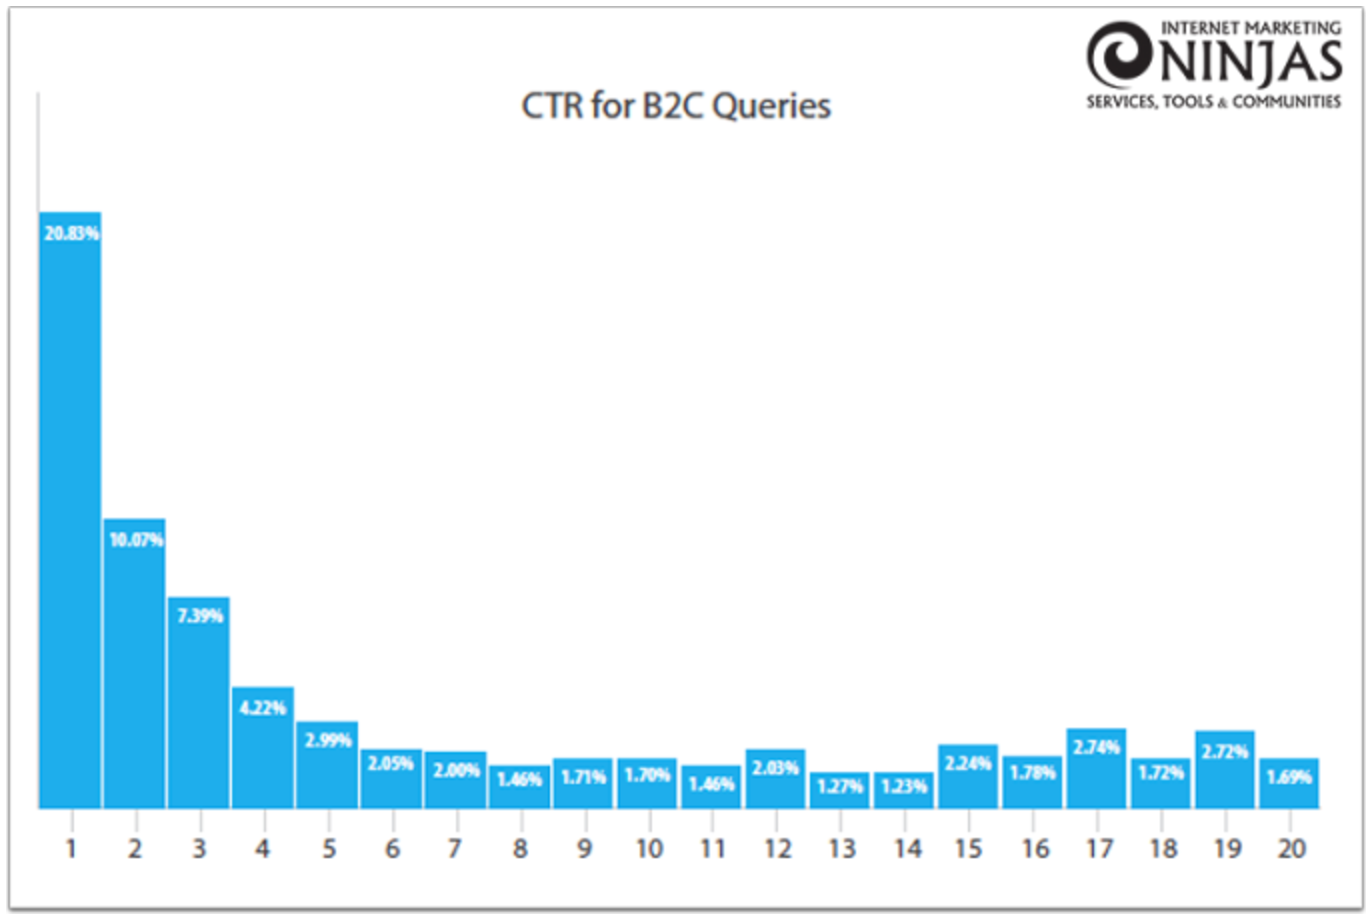
 Next up was to look at the B2C data and see how that played out in isolation, the results are fairly similar to the overall results. This was to be expected, although the graph tappers off far quicker here than overall and when we're dealing with so many queries, a percent or two is quite a difference.
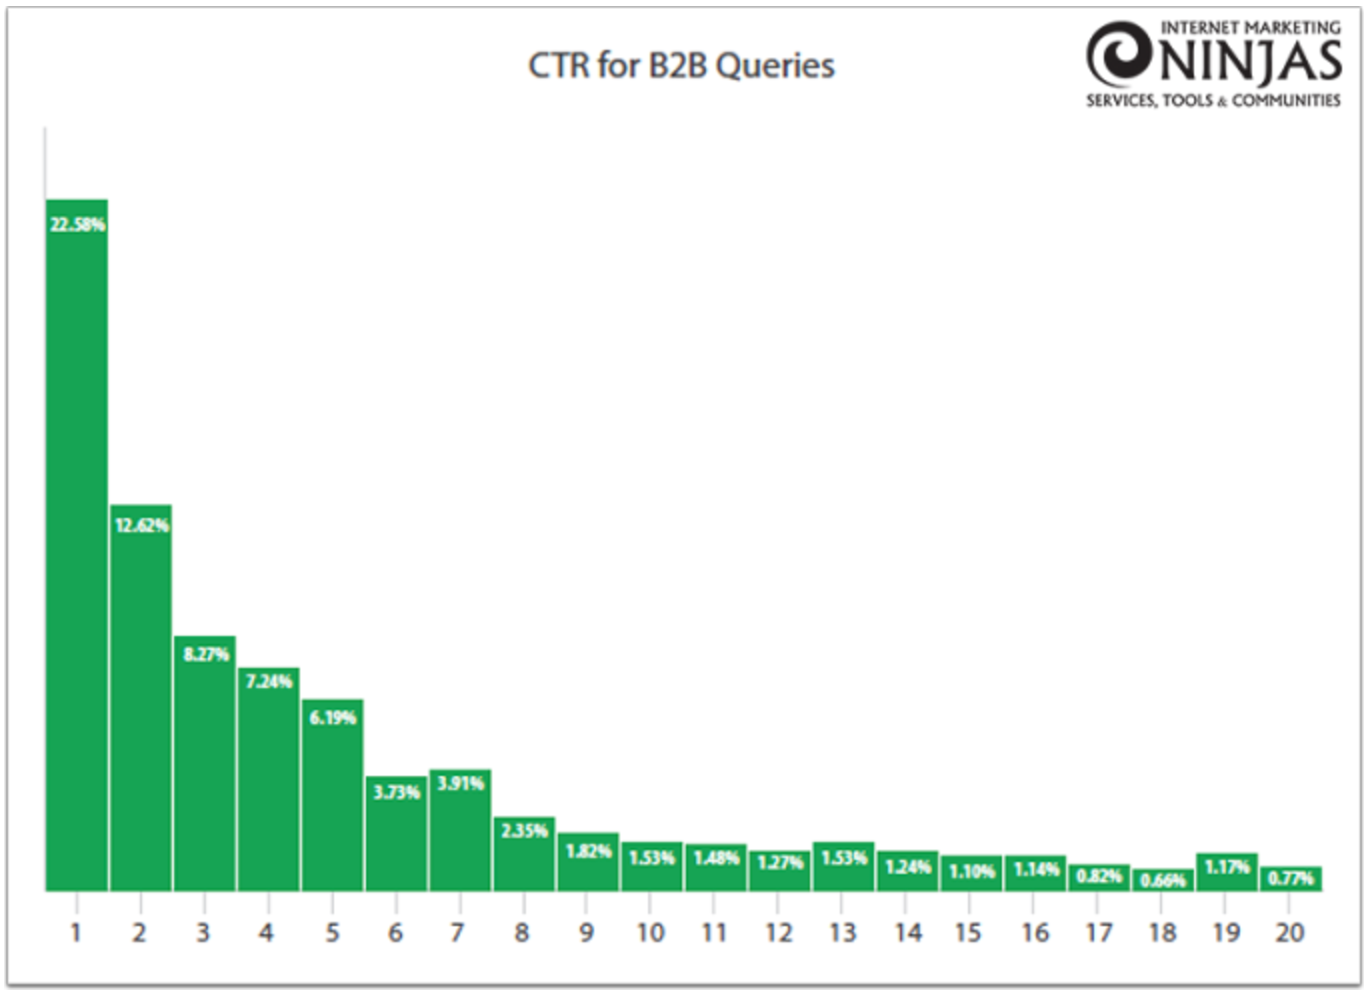
 B2B results showed that the first 6 or 7 results are most definitely where a website needs to be positioned in order to get attention from the searchers. Although this doesn't necessarily take long-tail terms into account and overall visibility of a website, it shows that the head-terms that most people want to target are indeed going to require a great deal of work to get into the top 7 positions.
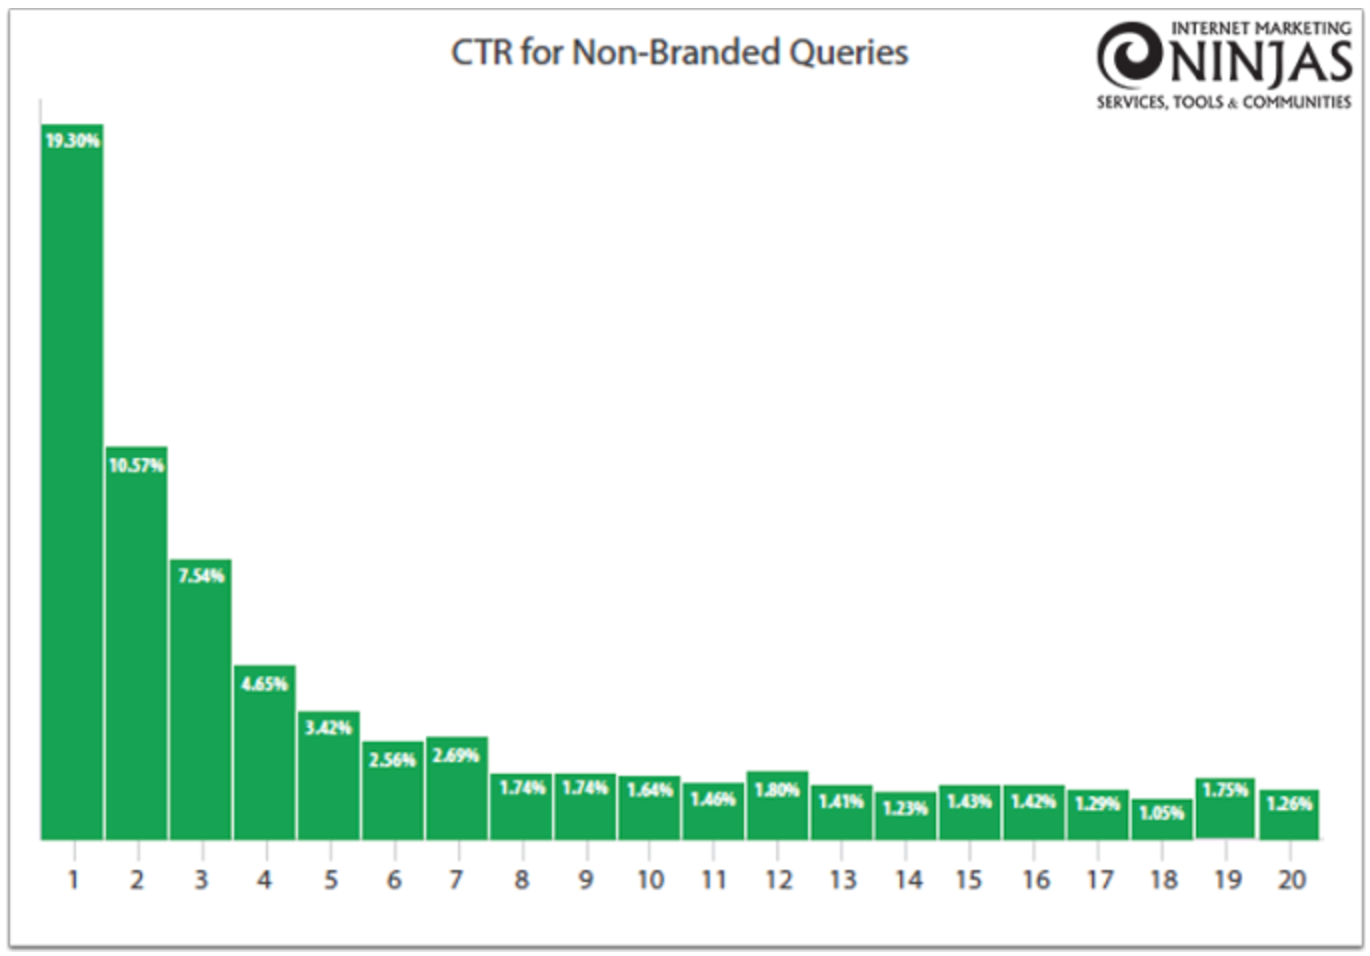
 A non-branded query is a search for a term that is not the name of a company. In other words, "imod digital seo" would be a brand query, whereas "seo cape town" would not be. The graph below shows us the non-branded queries and these are the ones that companies generally want to go after rather than branded ones.
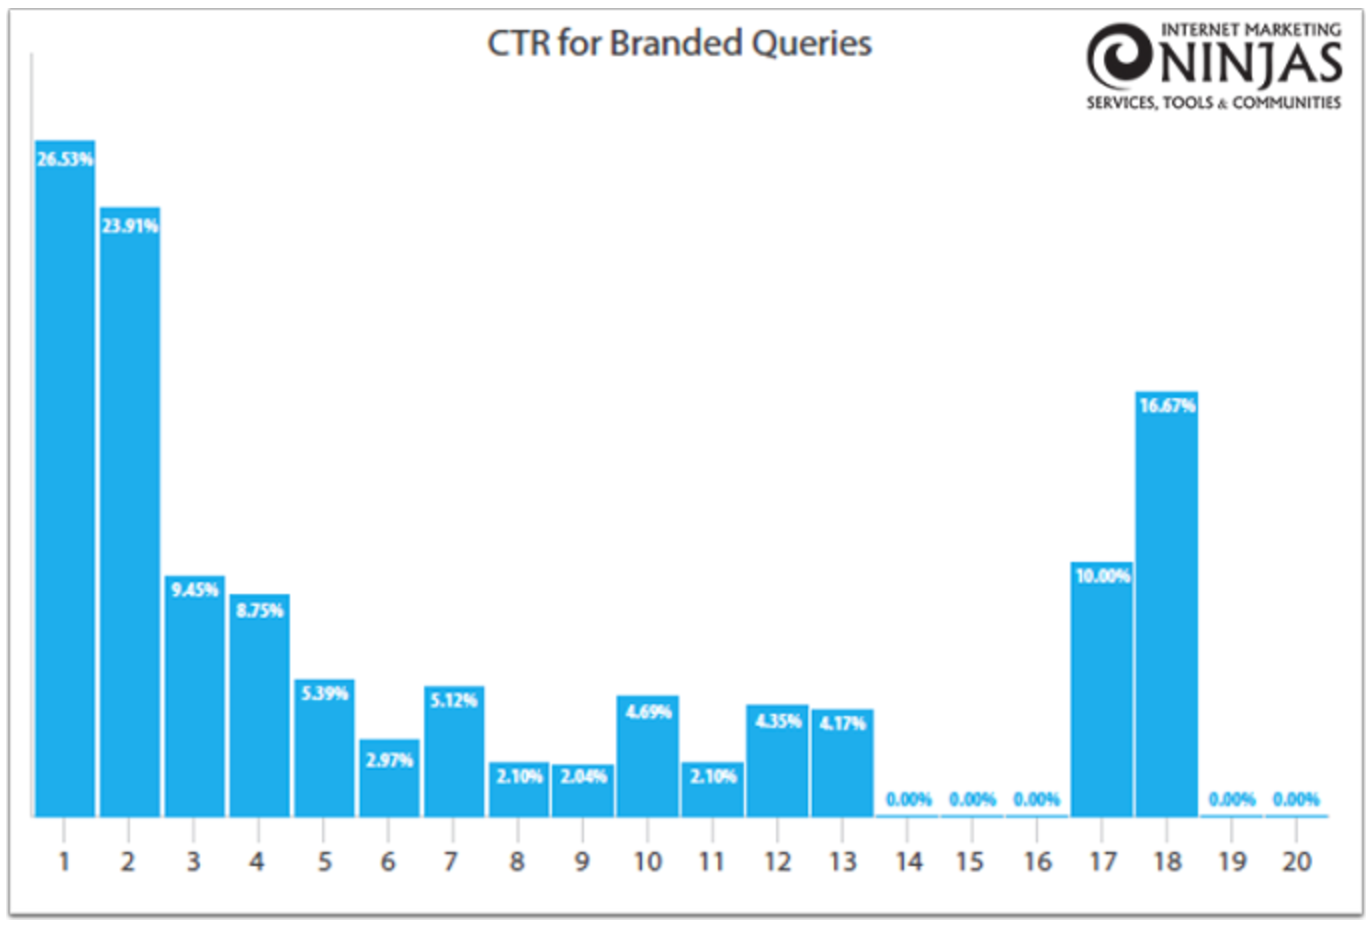
 Finally, they provided us with a brand query graph, which we'd expect the first couple of results to be the big CTR ones, but it's fascinating to see positions 17 and 18 coming into play. This shows that companies really need to take the time to make sure that when someone searches for them, the first two pages definitely have positive results and to not just focus on page one. That's 26.67% of brand query searches where people click to page 2 of the search results and then click on links!
 Here are some other interesting facts:
Next up was to look at the B2C data and see how that played out in isolation, the results are fairly similar to the overall results. This was to be expected, although the graph tappers off far quicker here than overall and when we're dealing with so many queries, a percent or two is quite a difference.
B2B results showed that the first 6 or 7 results are most definitely where a website needs to be positioned in order to get attention from the searchers. Although this doesn't necessarily take long-tail terms into account and overall visibility of a website, it shows that the head-terms that most people want to target are indeed going to require a great deal of work to get into the top 7 positions.
A non-branded query is a search for a term that is not the name of a company. In other words, "imod digital seo" would be a brand query, whereas "seo cape town" would not be. The graph below shows us the non-branded queries and these are the ones that companies generally want to go after rather than branded ones.
Finally, they provided us with a brand query graph, which we'd expect the first couple of results to be the big CTR ones, but it's fascinating to see positions 17 and 18 coming into play. This shows that companies really need to take the time to make sure that when someone searches for them, the first two pages definitely have positive results and to not just focus on page one. That's 26.67% of brand query searches where people click to page 2 of the search results and then click on links!
Here are some other interesting facts:
- The overall CTR's for position 1 is lower than previous reports.
- The CTR for the first 20 positions did not drop lower than 1%.
- There was an upwards movement in CTR for the top half of results on page 2.
- 25-35% of impressions for search results didn't result in a click at all!
- With a lot of impressions not resulting in clicks, is shows that the inclusion of knowledge graph, answers, and other rich media, have definitely played a roll and you should be investing time into getting this right.
- You need to invest time into ensuring that for the first 2 pages of results, that your company appears positively in the results. Get your social media accounts set up, invest in some press, run a blog and get your company exposure online.
- Don't only concentrate on SEO, invest some time and money into PPC to ensure that you're featuring well in Google's results.